
By Maximilian MOLDASCHL and Guillermo FELICES, PhD – BNPPAM
MACROECONOMIC VIEWS
Global growth converging towards trend–slowdown to persist in 2020, but US growth should outperform Europe and Japan. Central bank policy to remain easy–the room for further easing looks limited in Europe and Japan,but there is more scope in the US and China if needed.Fiscal policy could be a game changer–US and Chinese policies are already expansionary, but the hurdles for European fiscal stimulusare high.
KEY THEMES & RISKS
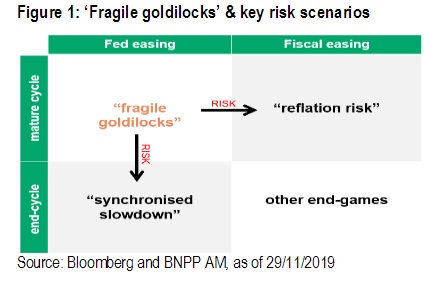
‘Fragile goldilocks’ holds –data arestabilising, central bankpolicy is loose, and short-term de-globalisation dynamics are supporting risky assets.Bewarethe risks–after a strong 2019, our base case is vulnerable to a more entrenched ‘synchronised slowdown’ or a sustained ‘reflation’ environment. Fixed income is most at risk –we see fixed income markets as being most at risk from a sustained move to reflation.
ASSET ALLOCATION
Modus operandi: nimble & diversifying –strategic risk/reward is unattractive as our base case is also vulnerable to tail risks/end-cycle dynamics. We see merit in a nimble approach and in building robust portfolios/diversifying.Overweight equities –in the latest dip,we added overweight positions in equities again, and aim to remain nimble.Underweight core EMU duration –we aim to be nimble and have reduced our short exposure given yield moves. But risks from reflation remain large for rates.Search for yield –we still believe in searching for yield. We are maintaining a high-carry EM external debt position and anEMU REITs trade.
LOOKING AHEAD TO 2020
2019 turned out to be very different to what most market participantshad expected at the turn of the year. This time last year, weakening data, escalating tension between the US and Chinaand a seemingly agnostic Federal Reserveovertightening US monetary policy caused a large correction to riskassets in Q4 2018and indeed left 2018 full-year returns in the red for equities, credit and commodity markets.Returns so far in 2019 have swung in the other direction: most major assets are in positive territory (Figure 2). Such cross-asset positivity can be easily summarised in one common theme: a central bankengineered goldilocksenvironment. Indeed, the Fed’s‘pivot’ early this year and the subsequent easingof US monetary policy, together with dovish turns by other leading central banks, has driven a strong bid for risky assets and safe havens alike.That said, flare-ups on the geopolitical front –notably continued Sino-US tension –threw a spanner in the works several times, making 2019 a ‘trader’s year’ rather than a ‘buy-and-hold year’, which overall YTD returns do not portray at first sight.
Looking ahead to 2020, we continue to see less rapid–closer to trend –global growth with risks to the downside, but at the same time dovish monetary policy counteracting this. The main tail risks (which weexplore in detail below) stem from geopolitics and inflation. Overall, the characterisation of a ‘fragile goldilocks’ –a supportive ‘not too hot and too cold’ mix of growthand inflation where monetary policy is easy –is stillvalid. We are cautiously optimistic for now, but atthe sametime, our asset allocation modus operandi will remain nimble in 2020.
MACRO: CHALLENGES ALL AROUND
We expect global growth to slow further in 2020, converging towards trend in major economies. In the developed world, we see US growth outperforming Europe and Japan (Figure 3). In the US, consumption should remain solid and more than compensate for the more challenging path for business investment ahead of the US elections, trade tensions and potential end-cycle risks.
We expect growth in the eurozone to stabilise, supported by external demand and, at the margin, by easy ECB policy. These forces should be enough to deliver growth slightly above trend in 2020. There are high hopes for fiscal policy easing given the explicit pressure from the ECB and other officials. However, we doubt there will be amaterial change in stance in the absence of a recession. Germany has fiscal room,but lacks the willingnessto spend.The opposite is true in southern Europe. In China, the slowdown is structural and cyclical in nature. Challenging demographics, de-globalisation and a shift from public investment to private consumption are material headwinds. However, targeted policy stimulus and a trade war truce should allow growth to stabilise. While we expect no big acceleration in policy stimulus, the current push is already helpingChina’s economy to stabilise and trading partners should feel the effects, notably in Asia and the eurozone (Figure 4).
Monetary & fiscal policy divergences
One of the most notable developments of 2019 was the Fed ‘pivot’in January and the wave of central bank easing that followed. The Fed’sstance went from restrictive to neutral, and if rates market are correct, it could shift again into expansionary territory in 2020 and beyond(Figure 5).
The return of central banks puts has hugely supportedmarkets, but at the same time, investors are worried about the potential lack of central bank firepower in the face of a downturn. This concern is clearly justified in the case of the eurozone and Japan where monetary policy is stretched. However, it is lesspressing in the US and China. Both their central banks have plenty of room to conduct counter-cyclical policy if needed
Fiscal policy has also been supportive in the US.Unlike previous cycles, fiscalpolicyis expansionary at a time when the unemployment rate is close to historical lows (Figure 6)
This contrasts with a broadly neutral fiscal stance in the eurozone. As argued earlier, we do not expect any surprises here, but the risks are skewed to the easing side, in our view. In the US, while the stance is already more expansionary, the current stimulus is likely to roll over andwe expect no further stimulus in an election year.
‘FRAGILE GOLDILOCKS’HOLDS
Date are weak, butstabilising
Ever since Q4 2018, macroeconomic data has been clearly weak for many major economies –especially so for countries reliant on manufacturing and ones close to the tension between China and the US (e.g. Germany). That said, recent data has shown early signs of stabilisation, even in the manufacturing PMIs which were at the heart of investorconcerns (Figure 7)
It is cruciallyimportantthat this stabilisation comes at a time when major central banks are easing or have set a high bar for tightening (see above discussion). In fact, as regular readers know, we have previously shown how Chinese easing is often a precursor to an upswingor stabilisation–depending on the strength of the impulse–in developed markets (ex the US)with a lag of two to three quarters. Put differently, the consensus underestimatesthe importance of China. We seethe current stabilisation in e.g. Germany’smacroeconomicdata as partially a spill-over from Chinese policy efforts.These factors have given investors hope, and we have seen a mini reflationary impulse with risky assets rallying in tandem with government bond yieldsrising. Indeed, at the time of writing, major equity markets are pushing to new record highs.Despite looming tail risks (see below discussion), we believe it is too early to call for recession just yet, unless the China-US trade warescalates. Especially in the US, where consumption is key, domestic indicators have held up. We reiterate that both the labour market and consumption have remainedon a solid footing. Consumer confidence, while off its highs, is nowhere near falling by as much as it usually does heading into recessions. In addition, initial jobless claims have held near their absolute lows (Figure 8) and, crucially, have not risen to anywhere near the previous pre-recession dynamics (Figure 9).
US-China ‘phase one’ deal helpful
Adding to the reflation euphoria in markets of late is of course the recent de-escalation in the China-US trade war, with both sides inchingtowards a preliminary,‘phase one’ deal.Our core view has been that a multitude of factors –not just trade –underliesthe Sino-US tension and that as a result these are likely to be a permanent feature in the years to come (see discussion below). And indeed, whilea‘phase one’ agreement would be a step in the right direction, it only scratches the surface in terms of the issues between the two superpowers.
But ahead of the US election, President Trump will be keen to ramp up his currently dire approval ratings, which have not been helped by uncertainty over the trade conflict (Figure 10). He may become less tough in negotiations with the Chinese headinginto the election. So,in say the next three to six months, such de-globalisation dynamics could support markets, but in the medium to long term,hurdles remain(see discussion below).
Key differences to Q4 2018 leave us optimistic
There are similarities to Q4 2018 –macroeconomic data has been weaker, political uncertainty is high, and trade tension, bar recent improvements, is perhaps even more negative now as tariffs are in place.However, there are also differences.For one, and this is keyfor markets, major central banks have been looseningmonetary policy. This contrasts with last year’s tightening bias. As explained above, the Fed in particular has been undoing last year’s overtightening (seeFigure 5) and policymakers have confirmed that there is an asymmetry towards easing. Other central banks have also started easing policy. Two other differences worth highlighting are investor positioning and valuations. Both are supportive now. Various indicators suggest investors are positioned more defensively compared to their bullish stances late in 2018. After the fall in global bond yields, relative valuations of equities and bonds make equities look less rich now than in 2018. In the US, for example, the gap between the S&P 500 earnings yield and bond yields is almost 200bp wider than before the 2018 sell-off (Figure 11).
Overall, the comparison to the mid-cycle ‘insurance cuts’by the Fed in the late 1990s still comesto mind. Back then, against a weakening external backdrop,but robust domestic data, the Fed eased rates and subsequently the economy (and markets) took off rapidly again. In fact, in a similar vein to now and also to 2011 and 2015, we saw non-manufacturing PMIs remain robust despite a weakening on the manufacturing side, and risk asset returns from there on were strong (Figure 12).
BEWARE THE RISKS
All year long we have been quite explicit about the risks around our ‘fragile goldilocks’ base case scenario. We see theserisks also prevailing in 2020.
One obvious channel through which a ‘synchronised slowdown’ could gain traction is re-escalating trade tension. Since de-globalisation is a long-term themefor us,we thinkit is unlikely to be solved by a trade deal between the US and China. For this reason,we depict a downward sloping trend in Figure 14. Along this downtrend,we have seen waves of escalation and de-escalation. Towards the end of 2019,the hope of a deal provided some relief to markets. Overall, however, we believe we are not out of the woods. The battle for global power (notably around IT) could easily sour markets again in 2020.
A more marked slowdown in China could also weakenthe global economy and harm markets. As mentioned, China’s challenges are structural and cyclical and Beijing has been more cautious with countercyclical policies. This meansthe risk isthat growth prospects could worsen,while decisive policy action may arrive too late. Finally, an unavoidable risk to global markets is the US presidential election next November. In our view, the risk here is that political uncertainty may eventually hurt the so far resilient US consumer. Aleft-leaning democratic nominee such as Elizabeth Warren could cause market volatility because her agenda involves corporate regulation and higher taxes. We believe this risk cannot be ignored:she is strong inthe democratic nomination polls, even if she has lost traction recently (Figure 15).
Both of these risks (China-US tensions and US elections) could upset investment prospects in the US. Historically, manufacturing activity surveys such as the PMIsdeteriorate when sentiment weakens and this tends to affect investment output. So far,investment growth has slowed and more economic and political uncertainty could exacerbate this path (Figure 16).
‘Good’vs. ‘bad’reflationAnother risk scenario that could potentially introduce marketvolatility is reflation. In principle,reflation –the return of inflation as the economy expands–is a healthy economic development. This ‘good reflation’was,for example, evident in 2017, when the US economic expansion supported earnings growth, more than compensating for the Fed’s tighter monetary policy. Fiscal policy expansion is certainly a way to good reflation. Even if the economic recovery leads to Fed tightening and higher US yields, equity markets could rally.‘Bad reflation’ would be more damaging. This is an environment where inflation rises and growth lagsor contracts. Examples are the oil (supply) shocks of the 1970-80s or fiscal profligacy (Figure 17). Trade tension or a left-leaning democratic victory in the US elections could feel like a supply shock and weigh on equity prices as inflation expectations de-rail rates.
Most of Q4 2019gave us a taste of ‘good reflation’. Diminishing trade war risk and more stable manufacturing data have led to higher yields and equities(Figure 18).We see this as consistent with our goldilocks environment as it is too early for central banks (notably the Fed) to unwind their recent easing.
Even though bad and good reflation could have opposite consequences for equity markets, both are likely to damaging for bonds. Furthermore, the risk in fixed income markets is more skewed to the downside than in equities as governmentbond yields are close to multi-decade lows (Figure 19).
We recognisethat such lows in bond yields have partly supported equity valuations in the face of challenging growth. As such, if good reflation persists,central banks may have toeventuallyresort to tighter policies, rates could rise,and the end-result could be a fall in equity pricesfurther out
ASSET ALLOCATION*** We have introduced our new asset allocation portfolio optimiser –‘MFA’ –which uses factor analysis to map core asset views to factor exposures across all our Multi-Asset portfolios, from the flexible to the very constrained. Please read our white paper herefor details. We now also communicate views from a ‘factor viewpoint’as a result. ***
Modus operandi: nimble & diversifyingOur base case remains ‘fragile goldilocks’, but the probabilities of our alternative scenarioshave remainedhigh. Broadly speaking, we thus continue to be nimble in our asset allocation views and think strategicdirectionalrisk/reward is unattractive. Indeed, as we show in Figure 20where we look at monthly price trend reversals, in the last 18 months, equities have not been good momentum tradesanymore. Add to this that end-cycle dynamics are looming and that the gyrations around US-China tension are hard to predict, andwe also continue to see meritin building robust portfolios and diversifying our allocation
Core views and factor exposuresThe recent price action of higher stocks and higher yields has boded well with our main factor exposures (Figure 21) –the biggest is an overweight in Market Risk(although we tactically reduced our equity overweight a bit recently), and until recently,a slight underweight in Duration(given the yield back-up,we reduced our short EMU duration view). The Market Riskexposure is mainly due to our overweight in equities, but also due to other views such as the overweight in emerging market hard currency debt. Our Durationfactor exposure is roughly neutral now, even though we are still slightly underweight EMU bonds, given the offsetting nature of search-for-yield trades such as the long in EM externaldebt.
As for the other factors, with most of our other views in the relative value space or offsetting each other, factor loadings are currently small outside of Market Risk.
Overweight equities –exploiting tactical opportunitiesWe continue to operate with a nimble approach. After taking profits in September,a renewed correction in global stock markets in early October allowed us to add to Market Riskvia US and European equitiesonce again. Since then, with major markets pushing to new all-time highs and our market dynamic indicators flashing redin the short run, we have reduced our exposure somewhat recently (Figure 22). We aim to continue managing equities with a nimble approach.In terms of factor exposures, our equity overweight tiltclearly addsMarket Riskexposure, making this the most prevalent factorexposure currently.
Underweight core EMU durationWe have been underweight core EMU duration for some time, and here too we are trying to be more nimble. So,after a yield back-up of around 40bp in recent weeks, we have reduced our short (Figure 23). Nonetheless, the risks from a sustained move to reflation remain large.As we exploredabove, fixed income markets show up as especially rich across the board and the risk/reward for underweights in core government bond markets is attractive for the medium to long term.From a factor exposure viewpoint, this trade adds negative Durationto portfolios,albeit counteracted by other views such as our long in EM debt.
Searching for yieldWe still expect the drivers of our ‘fragile goldilocks’ base case, especially continued central bank easing, to prolong the search for yield, and we continue to focus on finding attractive entry points in high-carry assets. In this light, we have held an overweight in EM hard currency debt. We see three positives for this trade in an environment of moderate global growth such as our ‘fragile goldilocks’ base case. First, EM debt does well in times of central bank easing and stableor falling real yields (Figure 24). Second, it is one of the few liquid fixed income asset classes that yields close to 5% in USD terms. Finally, EM spreads tend to compress when Chinese policy is being eased, which is the case currently.In factor terms, this position adds Durationexposure, countering the effects of the underweight in core EMU bonds, and introduces exposure to the EM & Commoditiesfactor.
Elsewhere, REITs are another market that should be supported by investors grabbing yield and we have added a long eurozone REITs position recently (Figure 25).The main rationale for this trade is that prices are close to five-year lows relative to net asset value; that it offers an attractive yield; and being a ‘real’asset, REITshave defensive characteristics, helpful in the case of a downturn or higher inflation.We have implemented this view as a RV trade against large-cap equities and core bond markets to ensure the factor exposures of this trade do not significantly counteract our convictions in core asset classes. The factor exposures of this RV trade are minimal: the main one is a slight tilt towards Market Risk.
Building robust portfolios
Regular readers will be familiar with our mantra of building robust portfolios. We have implemented various views along these lines in recent months, specifically around three pillars:Ongoing de-globalisation Inflation riskGeneral portfolio diversifiers/risk off-hedgesOn the first, given our structural bearish view on de-globalisation, we have held two trades specifically geared to Sino-US tension.
Firstly, a long in CAC/DAX. We see German equities as more geared to the manufacturing slowdownand trade war than French stocks. Since inception, this trade has done well, although recently, idiosyncratic factors related to earnings have caused volatility, but we still see this as a trade that can do well in bouts of escalating geopolitical tension.In factor exposure terms, the two RV legs have almost identical exposures and thus the factor profile of the RV trade is almost negligible. Elsewhere, in currency markets, we are long the US dollar versus low-yielding Asian FX crosses. Our basket is correlated to USD/CNY and did well in periods of trade war stress (Figure 26).We see this low carry-cost trade as a good portfolio diversifier/hedge.Note that this is an example of a specific trade implemented outside of the new optimiser, and it thus does not affect the factor exposures of our broad book of business discussed elsewhere. Accordingly, as it is thus not factorised, it will also not be implemented in every portfolio.
On the second pillar –inflation risk –together with our duration underweight in EMU bonds, we are long US breakeven inflation, a trade originating from a valuation perspective, but also a viable hedge to a reflationary impulse. Indeed, in recent weeks, this trade did well, recuperating some of the prior losses (Figure 27). This is also an example of a specific trade implemented outside of ournew optimiser.
Finally, on the third pillar, we recently implemented two additional diversification trades.The first is a long in JPY versus EUR. We see scope for the yen to rally in a risk-off market shock, especially given the currency’s cheapness (Figure 28). Put differently, with the Bank of Japan already near the absolute lower policy bound, the yen would not just benefit from its safe-haven characteristics, but also from a recessionary environment where other central banks would easeand rate differentials would support the yen. The EUR short also acts a hedge to EMU break-up risk. From a factor viewpoint, the main factorloading on short EUR/JPY is a negative exposure to Market Risk.
Finally, we added a long in gold last monthas a portfolio diversifier.Given its limited supply and zero yield, it should be supported in the status quo where central banks are debasing their fiat currencies and operating with negative yields(gold’s zero yield effectively has become a positive yield). Nevertheless, in riskscenarios, gold could be an attractive asset.Both in a risk-offor recession scenario and in an inflationary shock, gold should be well supported. This is also a specific trade implemented outside of our new optimiser, so it does not affect the factor loadings of the broad book of business discussed above.
CONCLUSIONS: NIMBLE GIVEN END-CYCLE DYNAMICSIn summary, looking ahead to 2020, we see closer to trend growth with risks tilted to the downside, but at the same time dovish monetary policy counteracting this. In other words, acontinuation of the goldilocks environment.At the same time, tail risks loom large, mainly stemming from geopolitics and inflation.Developments on this front could quickly disrupt the status quo.We continue to characterise our base case as a ‘fragile goldilocks’ environment. From an asset allocation perspective, this means that we expect 2020 to be ayear where a nimble modus operandi and robust/diversified portfolios can pay off