

Since putting in a high on 04 January 2022 at 4818 the S&P500 has been in correction mode even breaching the
20 percent bear market level. The question now becomes, how low can we go on the S&P before we put in a
bottom. To help answer this qustion please refer to Figure 1.
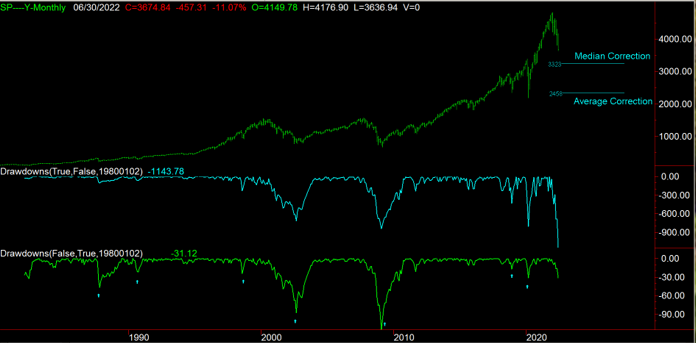
Figure 1: S&P500 monthly bars with Drawdowns in points and percent
Figure 1 shows the S&P500 monthly bars going back to the 1987 crash. Subgraph2, the Cyan plot shows
corrections from the Highest high in points and subgraph3, the Green plot shows corrections from the
Highest high in percent. If one looks at the Cyan plot in points, one might conclude that we have corrected
quite a bit since the high made on 04 January 2022.
That would be incorrect. In order to compare past corrections with the present one,
we must use the percent plot in subgraph3, this normalizes corrections.
In Figure 1, subgraph3, I have marked with arrows seven prior corrections going back to 1987.
Figure 2 details the dates, closes and percentage moves from the high.
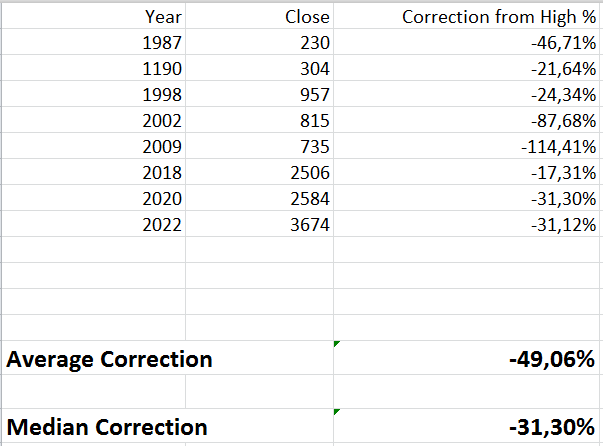
The most recent correction in 2022 appears in the table but is not included in the calculations.
Figure 2 shows that the average of the seven corrections is -49.06% from the recent high and
that the median correction is -31.30%. This gives us 2 possible targets on the downside for the
S&P500.
The target for the median correction is 3223- and the target for the average correction
Is 2458 as marked in Figure 1.
If history is any guide, this most recent correction which now stands at 31% has quite a bit
more downside to go. Time will tell.