
Solid top- and bottom-line performance: Revenue up by 5.6%, Beer volume growth of 1.1% and a 23.4% Underlying EPS increase

BRUSSELS--(BUSINESS WIRE)--Anheuser-Busch InBev (Brussel:ABI) (BMV:ANB) (JSE:ANH) (NYSE:BUD):
Regulated information1
“Cheers to beer – our performance this quarter reflects the strength of the beer category and the consistent execution of our strategy. Through investment in our megabrands and mega platforms, innovation and offering more choices across more occasions, we are strengthening the cultural relevance of our brands with consumers. Thank you to our colleagues for their commitment and disciplined execution, which position us well to continue our momentum.” – Michel Doukeris, CEO, AB InBev
Revenue +5.6% Revenue increased by 5.6% in 2Q26 with revenue per hl growth of 4.2% and by 5.7% in HY26 with revenue per hl growth of 4.3%.
Reported revenue increased by 11.0% in 2Q26 to 16 660 million USD and by 11.5% in HY26 to 31 927 million USD, positively impacted by currency translation.
6.2% increase in combined revenues of megabrands in 2Q26, led by Corona, which grew by 17% outside of its home market. 27% increase in revenue of no-alcohol beer in 2Q26. 44% increase in revenue of Beyond Beer in 2Q26. 50% increase in Gross Merchandise Value (GMV) from sales of third-party products through BEES Marketplace to reach 1.2 billion USD in 2Q26. Volumes +0.9% Volumes increased by 0.9% in 2Q26, with beer volumes up by 1.1% and non-beer volumes down by 1.1%. Volumes increased by 0.8% in HY26, with beer volumes up by 1.2% and non-beer volumes down by 1.5%.
| Normalized EBITDA +5.8% Normalized EBITDA increased by 5.8% to 5 938 million USD in 2Q26, with a margin expansion of 4bps to 35.6%. Normalized EBITDA increased by 5.6% to 11 375 million USD in HY26, with a margin contraction of 5bps to 35.6%.
Underlying Profit 2 390 million USD Underlying Profit was 2 390 million USD in 2Q26 compared to 1 950 million USD in 2Q25 and was 4 314 million USD in HY26 compared to 3 556 million USD in HY25. Reported profit attributable to equity holders of AB InBev was 3 751 million USD in 2Q26 compared to 1 676 million USD in 2Q25, and was 6 314 million in HY26 compared to 3 824 million in HY25, with HY25, 2Q26 and HY26 positively impacted by non-underlying items.
Underlying EPS 1.21 USD Underlying EPS increased by 23.4% to 1.21 USD in 2Q26, compared to 0.98 USD in 2Q25, and increased by 22.1% to 2.18 USD in HY26, compared to 1.79 USD in HY25. On a constant currency basis, Underlying EPS increased by 12.9% in 2Q26 and by 11.0% in HY26. |
Net Debt to EBITDA 2.86x Net debt to normalized EBITDA ratio was 2.86x at 30 June 2026 compared to 3.27x at 30 June 2025 and 2.87x at 31 December 25. | |
The 2026 Half Year Financial Report is available on our website at www.ab-inbev.com.
| 1The enclosed information constitutes regulated information as defined in the Belgian Royal Decree of 14 November 2007 regarding the duties of issuers of financial instruments which have been admitted for trading on a regulated market. For important disclaimers and notes on the basis of preparation, please refer to page 15. |
Management comments
Consistent and compounding growth with beer volume up by 1.1% and a 23.4% Underlying EPS increase
The momentum of our business continued in 2Q26, with broad-based volume growth and a 23.4% increase in Underlying EPS. While the consumer environment remains dynamic, consistent execution of our strategy and investment in our megabrands and mega platforms enabled solid top- and bottom-line results. We strengthened our portfolio brand power and estimate that we gained market share across our footprint, maintaining or gaining share in 70% of our markets.
Revenue increased by 5.6%, with total volume growth of 0.9% and a revenue per hl increase of 4.2%, driven by revenue management and positive mix from premiumization and Beyond Beer. Beer volumes grew by 1.1%, with record high second quarter volumes in Mexico, Colombia, and Ecuador. Beer volumes in Brazil returned to growth, and in the US we delivered continued top-line growth and market share gains in both beer and Beyond Beer.
EBITDA increased by 5.8% with flattish margins as overhead management enabled increased sales and marketing investment and offset transactional FX headwinds. Free cash flow increased by 2.5 billion USD versus HY25 to 3.9 billion USD, driven by disciplined execution and the continued optimization of our business.
Key highlights from the quarter included: global megabrand momentum, with Corona, Stella Artois and Michelob Ultra growing revenue by 17%, 19% and 21%, respectively, outside of their home markets; successful activation of the FIFA World Cup across our markets, supporting growth of Michelob Ultra in the US and providing a platform to expand the brand across key markets in Latin America; no-alcohol beer revenue growth of 27%, Beyond Beer revenue growth of 44%, and BEES Marketplace GMV growth of 50% to 1.2 billion USD.
Progressing our strategic priorities
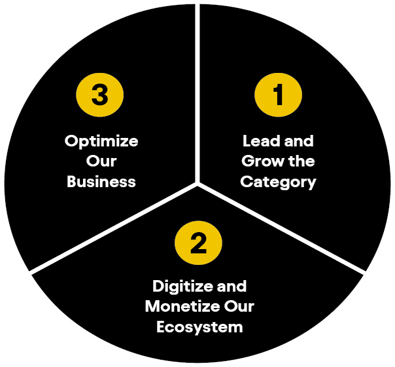
We are executing on three key strategic pillars to deliver consistent growth and long-term value creation.
(1) Lead and grow the category:
We strengthened our portfolio brand power and estimate that we gained or maintained share in 70% of our markets in 2Q26.
(2) Digitize and monetize our ecosystem:
BEES Marketplace GMV increased by 50% versus 2Q25 to 1.2 billion USD from third-party products. Overall BEES GMV increased by 16% versus 2Q25 to 15.0 billion USD.
(3) Optimize our business:
We continued to strengthen our balance sheet, with net debt to EBITDA improving to 2.86x as of 30 June 2026 from 3.27x as of 30 June 2025.
(1) Lead and grow the category
Investment in our megabrands and mega platforms continued to build portfolio brand power, with sales and marketing investment reaching 4.1 billion USD in HY26, up 9% versus HY25. According to the Kantar BrandZ 2026 report, our portfolio holds 8 of the top 10 most valuable beer brands in the world, with Corona and Budweiser ranked #1 and #2, respectively. Our mega platforms strengthened the cultural relevance of our brands during some of the world’s largest moments of celebration, including the Winter Olympics, Roland Garros, Wimbledon and the FIFA World Cup. Across these occasions, our portfolio achieved the #1 share of digital engagement and generated 850 million consumer engagements on social media. Our marketing capabilities were recognized as we were named the Cannes Lions 2026 Creative Marketer of the Year, making us the only company in history to receive this recognition three times.
We continued to execute on our category expansion levers and estimate that the number of legal drinking age consumers purchasing our portfolio increased in HY26 with gains in Beyond Beer and Balanced Choices.
- Core Superiority: Revenue of our mainstream portfolio increased by 2.7% in 2Q26, driven by double-digit growth in Colombia and high-single digit growth in Peru and Ecuador.
- Premiumization: Our above core beer portfolio delivered a 6.9% revenue increase in 2Q26, led by Corona, Stella Artois and Michelob Ultra, which grew revenue by 17%, 19% and 21%, respectively, outside of their home markets. Corona led the premiumization of our portfolio globally, delivering double-digit volume growth in 37 markets. Michelob Ultra expanded across Latin America in 2Q26, with 40% of its volume growth coming from markets outside of the US.
- Balanced Choices: Our portfolio of low carb, low calorie, sugar free, gluten free and no-alcohol beer brands delivered a revenue increase of 13% in 2Q26. Our no-alcohol beer portfolio led performance, with revenue up by 27% and estimated share gains strengthening our leadership in no-alcohol beer by value, according to Nielsen.
- Beyond Beer: Growth of our portfolio accelerated, increasing revenue by 44% in 2Q26. Performance was led by the expansion of Flying Fish globally and by Cutwater in the US, which increased revenue by triple-digits and was the 2nd largest contributor by brand to our overall revenue growth in 2Q26.
(2) Digitize and monetize our ecosystem
- Digitizing our relationships with more than 6 million customers globally: As of 30 June 2026, BEES was live in 30 markets with 72% of our revenues captured through B2B digital platforms. In 2Q26, BEES captured 15.0 billion USD in GMV, up 16% versus 2Q25.
- Monetizing our route-to-market; delivering more than 1 billion USD in quarterly GMV: BEES Marketplace GMV increased by 50% versus 2Q25 to approximately 1.2 billion USD from third-party products.
- Leading the way in DTC solutions: Our digital DTC megabrands, Zé Delivery, TaDa Delivery and PerfectDraft, served 13 million active consumers and generated 165 million USD in revenue, 12% growth versus 2Q25. Sales of third-party products through our DTC marketplace reached 50 million USD in GMV, a 63% increase versus 2Q25.
(3) Optimize our business
- Maximizing value creation: Continued optimization of our business and operating leverage through the P&L drove EBIT growth of 8.0% and a free cash flow increase of 2.5 billion USD versus HY25. We strengthened our balance sheet, with net debt to EBITDA improving to 2.86x from 3.27x as of 30 June 2025. As of 24 July 2026, we completed 1.9 billion USD of our 6 billion USD share buyback program announced on 30 October 2025.
- Advancing our sustainability priorities: Our water use efficiency ratio improved to 2.3 hl per hl in HY26 versus 2.4 hl per hl in HY25. Our average energy efficiency globally improved to 81.6 MJ/hl in HY26 versus 84.8 MJ/hl in HY25. Our absolute Scopes 1 and 2 emissions were 1.55 million metric tons of CO2e in HY26, a 0.8% decrease compared to HY25.
Continued momentum and reliable compounding growth
In HY26, our business delivered 5.7% revenue growth, 5.6% EBITDA growth and a 22.1% increase in Underlying EPS, driven by beer volume growth, revenue and cost management capabilities, and positive mix. We strengthened our portfolio brand power through investment in our megabrands and mega platforms, scaling our innovations and providing more choices across more occasions. Performance across our megabrands, Balanced Choices, Beyond Beer and BEES Marketplace reflects the strength of our portfolio and the consistent execution of our strategy.
The continued momentum of our business, disciplined execution by our teams and the strength of the beer category reinforce our confidence in our ability to deliver our FY26 outlook and create a future with more cheers.
2026 Outlook
(i) Overall Performance: We expect our EBITDA to grow in line with our medium-term outlook of between 4-8%. The outlook for FY26 reflects our current assessment of inflation and other macroeconomic conditions.
(ii) Net Finance Costs: Net pension interest expenses and accretion expenses are expected to be in the range of 190 to 220 million USD per quarter, depending on currency and interest rate fluctuations. We expect the average gross debt coupon in FY26 to be approximately 4%.
(iii) Effective Tax Rate (ETR): We expect the normalized ETR in FY26 to be in the range of 26% to 28%. The ETR outlook does not consider the impact of potential future changes in legislation.
(iv) Net Capital Expenditure: We expect net capital expenditure of between 3.5 and 4.0 billion USD in FY26.
Figure 1. Consolidated performance | |||||||||
in USD Mio, except EPS in USD per share and Volumes in thousand hls | 2Q25 | 2Q26 | Organic | ||||||
growth | |||||||||
Volumes | 143 347 |
| 144 003 |
| 0.9 | % | |||
Beer | 125 620 |
| 126 945 |
| 1.1 | % | |||
Non-Beer | 17 727 |
| 17 058 |
| (1.1 | )% | |||
Revenue | 15 004 |
| 16 660 |
| 5.6 | % | |||
Gross profit | 8 446 |
| 9 579 |
| 7.5 | % | |||
Gross margin | 56.3 | % | 57.5 | % | 99bps | ||||
Normalized EBITDA | 5 301 |
| 5 938 |
| 5.8 | % | |||
Normalized EBITDA margin | 35.3 | % | 35.6 | % | 4bps | ||||
Normalized EBIT | 4 013 |
| 4 604 |
| 8.0 | % | |||
Normalized EBIT margin | 26.7 | % | 27.6 | % | 58bps | ||||
| |||||||||
Profit attributable to equity holders of AB InBev | 1 676 |
| 3 751 |
| |||||
Underlying Profit | 1 950 |
| 2 390 |
| |||||
| |||||||||
Basic EPS | 0.84 |
| 1.90 |
| |||||
Underlying EPS | 0.98 |
| 1.21 |
|
| ||||
HY25 | HY26 | Organic | |||||||
growth | |||||||||
Volumes | 279 615 |
| 280 412 |
| 0.8 | % | |||
Beer | 243 005 |
| 245 426 |
| 1.2 | % | |||
Non-Beer | 36 611 |
| 34 987 |
| (1.5 | )% | |||
Revenue | 28 632 |
| 31 927 |
| 5.7 | % | |||
Gross profit | 16 029 |
| 18 225 |
| 7.4 | % | |||
Gross margin | 56.0 | % | 57.1 | % | 88bps | ||||
Normalized EBITDA | 10 156 |
| 11 375 |
| 5.6 | % | |||
Normalized EBITDA margin | 35.5 | % | 35.6 | % | (5)bps | ||||
Normalized EBIT | 7 601 |
| 8 677 |
| 7.6 | % | |||
Normalized EBIT margin | 26.5 | % | 27.2 | % | 46bps | ||||
| |||||||||
Profit attributable to equity holders of AB InBev | 3 824 |
| 6 314 |
| |||||
Underlying Profit | 3 556 |
| 4 314 |
| |||||
| |||||||||
Basic EPS | 1.92 |
| 3.20 |
| |||||
Underlying EPS | 1.79 |
| 2.18 |
|
| ||||
Figure 2. Volumes | ||||||||||||||||
in thousand hls | 2Q25 | Scope | Organic | 2Q26 | Organic growth | |||||||||||
growth | Total | Beer | ||||||||||||||
North America | 22 376 | 218 |
| (164 | ) | 22 430 | (0.7 | )% | (0.8 | )% | ||||||
Middle Americas | 38 822 | (634 | ) | 1 806 |
| 39 994 | 4.7 | % | 4.8 | % | ||||||
South America | 34 199 | - |
| 466 |
| 34 665 | 1.4 | % | 3.9 | % | ||||||
EMEA | 24 172 | (135 | ) | 201 |
| 24 239 | 0.8 | % | 0.9 | % | ||||||
Asia Pacific | 23 716 | (21 | ) | (1 109 | ) | 22 586 | (4.7 | )% | (4.7 | )% | ||||||
Global Export and Holding Companies | 62 | 14 |
| 12 |
| 89 | 16.3 | % | 16.3 | % | ||||||
AB InBev Worldwide | 143 347 | (557 | ) | 1 213 |
| 144 003 | 0.9 | % | 1.1 | % | ||||||
HY25 | Scope | Organic | HY26 | Organic growth | ||||||||||||
growth | Total | Beer | ||||||||||||||
North America | 42 218 | 121 |
| (779 | ) | 41 561 | (1.8 | )% | (1.9 | )% | ||||||
Middle Americas | 73 903 | (1 362 | ) | 3 439 |
| 75 979 | 4.7 | % | 5.2 | % | ||||||
South America | 75 089 | - |
| 341 |
| 75 430 | 0.5 | % | 2.2 | % | ||||||
EMEA | 44 924 | (230 | ) | 476 |
| 45 169 | 1.1 | % | 1.2 | % | ||||||
Asia Pacific | 43 365 | (39 | ) | (1 192 | ) | 42 134 | (2.8 | )% | (2.7 | )% | ||||||
Global Export and Holding Companies | 116 | 22 |
| 1 |
| 139 | 0.8 | % | 0.8 | % | ||||||
AB InBev Worldwide | 279 615 | (1 489 | ) | 2 286 |
| 280 412 | 0.8 | % | 1.2 | % | ||||||
Key Markets Performance
United States: Portfolio momentum drove beer and Beyond Beer share gains and continued top-line growth
-
Operating performance:
- 2Q26: Revenue increased by 2.7%, with revenue per hl increasing by 3.3% driven by revenue management and positive brand mix. Sales-to-retailers (STRs) declined by 1.9%, estimated to have outperformed a soft industry. Sales-to-wholesalers (STWs) declined by 0.6%. EBITDA increased by 0.1%, as top-line growth and productivity initiatives were reinvested in increased marketing to fuel momentum.
- HY26: Revenue increased by 1.9%, with revenue per hl increasing by 3.8%. STRs declined by 0.9% and STWs were down by 1.8%. Our STRs and STWs tend to converge on a full year basis. EBITDA increased by 0.2%.
- Commercial highlights: We were the #1 share gainer in total alcohol in both 2Q26 and HY26 driven by share gains in both beer and spirits, according to Circana. Our beer performance in 2Q26 was led by Michelob Ultra, Busch Light and Busch Light Apple, which were the top 3 volume share gainers in the industry. Our Beyond Beer portfolio continued to expand our total addressable market and delivered revenue growth in the mid-seventies. Cutwater grew revenue in the triple-digits and was the #1 share gaining brand in the total spirits industry. We are the leader in no-alcohol beer, with our portfolio gaining share and growing revenue in the mid-thirties led by Michelob Ultra Zero which was the #1 share gainer in no-alcohol beer.
Mexico: Market share gain and margin expansion drove mid-single digit top- and high-single digit bottom-line growth
-
Operating performance:
- 2Q26: Revenue and revenue per hl increased by mid-single digits, driven by revenue management and positive mix. Volumes grew slightly and outperformed the industry. EBITDA grew by high-single digits with margin expansion.
- HY26: Revenue grew by mid-single digits, with revenue per hl growth of mid-single digits and volume increasing by low-single digits, outperforming the industry. EBITDA grew by mid-single digits with flattish margins as top-line growth and productivity initiatives offset transactional FX headwinds and enabled increased marketing investment.
- Commercial highlights: We are strengthening our portfolio architecture and expanding our total addressable market by offering consumers more choices across more occasions. Performance in 2Q26 was led by our above core beer portfolio, which grew revenue by high-single digits driven by Modelo and Pacifico, while our mainstream beer portfolio grew by mid-single digits. We strengthened our position as the industry leader in no-alcohol beer, with our portfolio growing volume by high-thirties led by Modelo Cero and the launch of Michelob Ultra Zero. In Beyond Beer, our portfolio grew volume by high-teens, led by the Vicky’s brand family and Flying Fish.
Colombia: Record high volumes drove double-digit top- and bottom-line growth
-
Operating performance:
- 2Q26: Revenue increased by high-teens, with high-single digit revenue per hl growth driven by revenue management and premiumization. Volumes grew by low-teens, with our portfolio estimated to have gained share of total alcohol. EBITDA grew by high-teens as top-line growth and productivity initiatives offset transactional FX headwinds and enabled increased marketing investment.
- HY26: Revenue grew by mid-teens with mid-single digit revenue per hl growth. Volumes increased by high-single digits. EBITDA grew by mid-teens.
- Commercial highlights: Increased brand power drove momentum across our portfolio, with volume and revenue growth across all price segments in 2Q26 and record high second quarter volumes. Above core beer led our performance, with mid-teens volume growth driven by Corona. Our mainstream beer portfolio continued to grow, delivering a high-single digit volume increase.
Brazil: Market share gain and an improved industry drove beer volume growth and a double-digit bottom-line increase
-
Operating performance:
- 2Q26: Revenue increased by 7.8%, with revenue per hl growth of 5.3% driven by revenue management and premiumization. Beer volumes increased by 5.0%, estimated to have outperformed an improved industry. Non-beer volumes decreased by 4.4%, resulting in total volume growth of 2.3%. EBITDA increased by 16.1% with 230bps of margin expansion as disciplined revenue and cost management more than offset increased sales and marketing investment.
- HY26: Revenue grew by 8.1% with revenue per hl growth of 7.1%. Beer volumes grew by 2.9% and non-beer volumes declined by 4.1%, resulting in total volume growth of 0.9%. EBITDA increased by 13.1% with 149bps of margin expansion.
- Commercial highlights: Innovation and investment behind our megabrands and mega platforms strengthened our portfolio brand power and drove continued market share gains. Premium and super premium beer led our performance in 2Q26, delivering mid-twenties volume growth and strengthening our leadership position of the premium segment. Mainstream beer improved sequentially, delivering flattish volumes and estimated to have gained share of the segment. We are leading the industry in Balanced Choices, with volumes of our no-alcohol beer portfolio growing in the low-thirties and Stella Artois Pure Gold and Michelob Ultra growing by triple digits. In Beyond Beer, our portfolio grew volumes by strong double digits, led by Beats and Flying Fish.
Europe: Volume growth and premiumization drove a low-single digit top-line increase
-
Operating performance:
- 2Q26: Volumes grew by low-single digits, estimated to have gained or maintained share in the majority of our key markets. Revenue and revenue per hl increased by low-single digits driven by premiumization. EBITDA declined by low-single digits, with top-line growth primarily offset by increased sales and marketing investment.
- HY26: Volumes grew by low-single digits, estimated to have gained share in 5 of our 6 key markets. Revenue and revenue per hl increased by low-single digits driven by premiumization. EBITDA declined by low-single digits.
- Commercial highlights: Market share gains, innovation and premiumization drove low-single digit volume growth in both 2Q26 and HY26. Our performance in 2Q26 was driven by our megabrands, led by Corona which delivered mid-teens volume growth. We are building strong consumer connection with our brands through our mega platforms and innovations. We successfully activated Roland Garros with Stella Artois, launched Stella Artois Strawberries & Cream ahead of Wimbledon and expanded the availability of Modelo Especial in the UK. Our no-alcohol beer portfolio grew volumes by low-teens, led by Corona Cero.
South Africa: Disciplined revenue management and margin expansion drove mid-single digit top- and bottom-line growth
-
Operating performance:
- 2Q26: Revenue and revenue per hl increased by mid-single digits, driven by revenue management and premiumization. Volumes declined by low-single digits, underperforming the industry. Beyond Beer volumes grew and are estimated to have outperformed. EBITDA grew by mid-single digits with margin expansion.
- HY26: Revenue and revenue per hl increased by mid-single digits. Volumes grew by low-single digits. EBITDA grew by low-single digits, with top-line growth partially offset by increased marketing investment.
- Commercial highlights: Investment in our megabrands and innovations drove increased portfolio brand power in 2Q26. Premium and super premium beer led our performance, delivering high-twenties volume growth and estimated to have gained share of the segment. In Beyond Beer, our portfolio gained share and grew volumes by low-twenties.
China: Top- and bottom-line declined, impacted by volume performance in a soft industry
-
Operating performance:
- 2Q26: Volumes declined by 9.7%, estimated to have underperformed a soft industry, which was impacted by adverse weather and continued weakness in the on-premise channel. Revenue per hl increased by 1.0% driven by positive brand mix, resulting in a revenue decline of 8.8%. EBITDA declined by 16.1%, impacted by top-line performance.
- HY26: Volumes declined by 6.0%. Revenue per hl decreased by 0.5% resulting in a revenue decline of 6.5%. EBITDA declined by 13.9%.
- Commercial highlights: Beer industry volumes are estimated to have declined by mid-single digits in 2Q26, reflecting adverse weather and softness in the on-premise channel. Our market share trend is estimated to have improved sequentially, supported by a return to growth in our super premium and core plus brands in the second quarter. Investment in our megabrands and innovations strengthened our portfolio brand power in the quarter. We remain focused on improving execution and expanding our in‑home channel presence to rebuild momentum and better position our business for ongoing channel shifts in the industry.
Highlights from our other markets
- Canada: Revenue grew by low-single digits in 2Q26 with mid-single digit revenue per hl growth driven by revenue management and positive brand mix. Our portfolio was estimated to be the #1 share gainer in both beer and Beyond Beer, while volumes declined by low-single digits amid a soft industry. Our beer performance was led by Michelob Ultra and Busch, which were the top two volume share gainers in the industry. Beyond Beer growth was led by Cutwater and Mike’s Hard Lemonade, two of the top four share gainers in the category.
- Peru: Volumes grew by high-single digits in 2Q26 with our portfolio estimated to have gained share of total alcohol. Performance was led by our mainstream beer brands which grew volumes by mid-single digits, and our Beyond Beer portfolio, which grew volumes in the triple-digits. Revenue grew by high-single digits with low-single digit revenue per hl growth.
- Ecuador: Volumes grew by mid-twenties in 2Q26 to reach a record high for the second quarter, driven by estimated market share gains and a strong industry in an improved consumer environment. Performance was led by our above core beer portfolio, which grew volumes by strong double digits. Revenue grew by high-twenties with low-single digit revenue per hl growth.
- Argentina: Beer volumes grew by low-single digits in 2Q26, estimated to have outperformed an improved industry. Total volumes declined by low-single digits, impacted by a soft non-beer industry. Revenue grew by mid-teens, driven by revenue management.
- Africa excluding South Africa: In 2Q26, Nigeria total volumes and revenue declined by low-single digits, impacted by a soft consumer environment.
Contacts
Investors
Shaun Fullalove
E-mail: shaun.fullalove@ab-inbev.com
Ekaterina Baillie
E-mail: ekaterina.baillie@ab-inbev.com
Patrick Ryan
E-mail: patrick.ryan@ab-inbev.com
Media
Media Relations
E-mail: media.relations@ab-inbev.com
Read full story here

